You view your data through the Clever Alert Dashboard. If you are not logged into the Dashboard, click here for instructions.

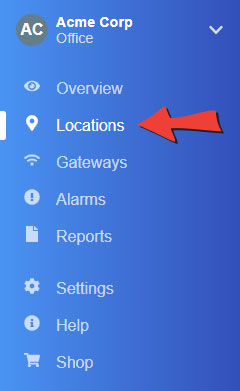
Click on Locations in the Clever Alert menu to see your locations.

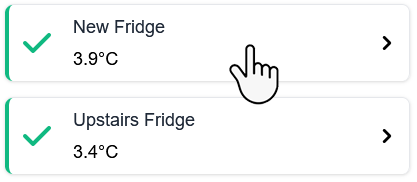
On this screen, you can see the current temperature and alarm status for each of your loggers.
Click on the location you wish to view
When you first click on a location, this is the screen you will see.
Every few minutes a new data point is added to graph. On this screen you can see, by default, seven days of data points.
You can zoom in on any section of the graph by clicking and dragging a square around the part of the graph you want to focus on with your mouse.
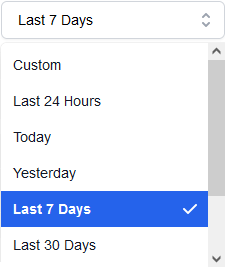
Quickly filter results from a selection of common date ranges.
Choose from:

Want to see data from a particular date range? These filters let you set a start and end time. Just remember that retrieving a large amount of data (e.g. a couple of months) might take a little while.
You can easily switch back and forth between seeing your data as a graph or as a table.
The Table View has has nice extra tricks, which you can read about below.
You can zoom in on any part of the graph by clicking and dragging a square around the data you want to magnify with your mouse.

To zoom out again, click on the Reset Zoom button at the top right of the graph.
Access the Table view by clicking the button at the top right of the graph.


There are three different filters: All Readings, Daily Min-Max and Half Daily Min-Max.
Click the images to enlarge.
Clever Alert has a whole amazing reporting engine, which we’ll cover on another page, but the Table view has a neat little trick for quick exports.

At the top right of each Table view you will find a button labelled Export as CSV.
CSV stands for “comma separated values”. It is a special format that can be opened by spreadsheet software – e.g. Microsoft Excel or Google Sheets.
To quickly export a table of data, select the date range you want, then click the Export as CSV button. Save the generated file to your computer.

Proudly developed, sold and supported by Aussies. You little ripper!
All prices are in Australian dollars and include GST

Clever Alert is a product of OnSolution Pty Ltd
Unit 38, 5 Anella Ave
Castle Hill NSW 2154
Australia